
Performance analytics for clubs and federations
Statlytics brings the Lemeister engine to the football department. Match and player performance, modeled and explained.
powered by MeisterIQ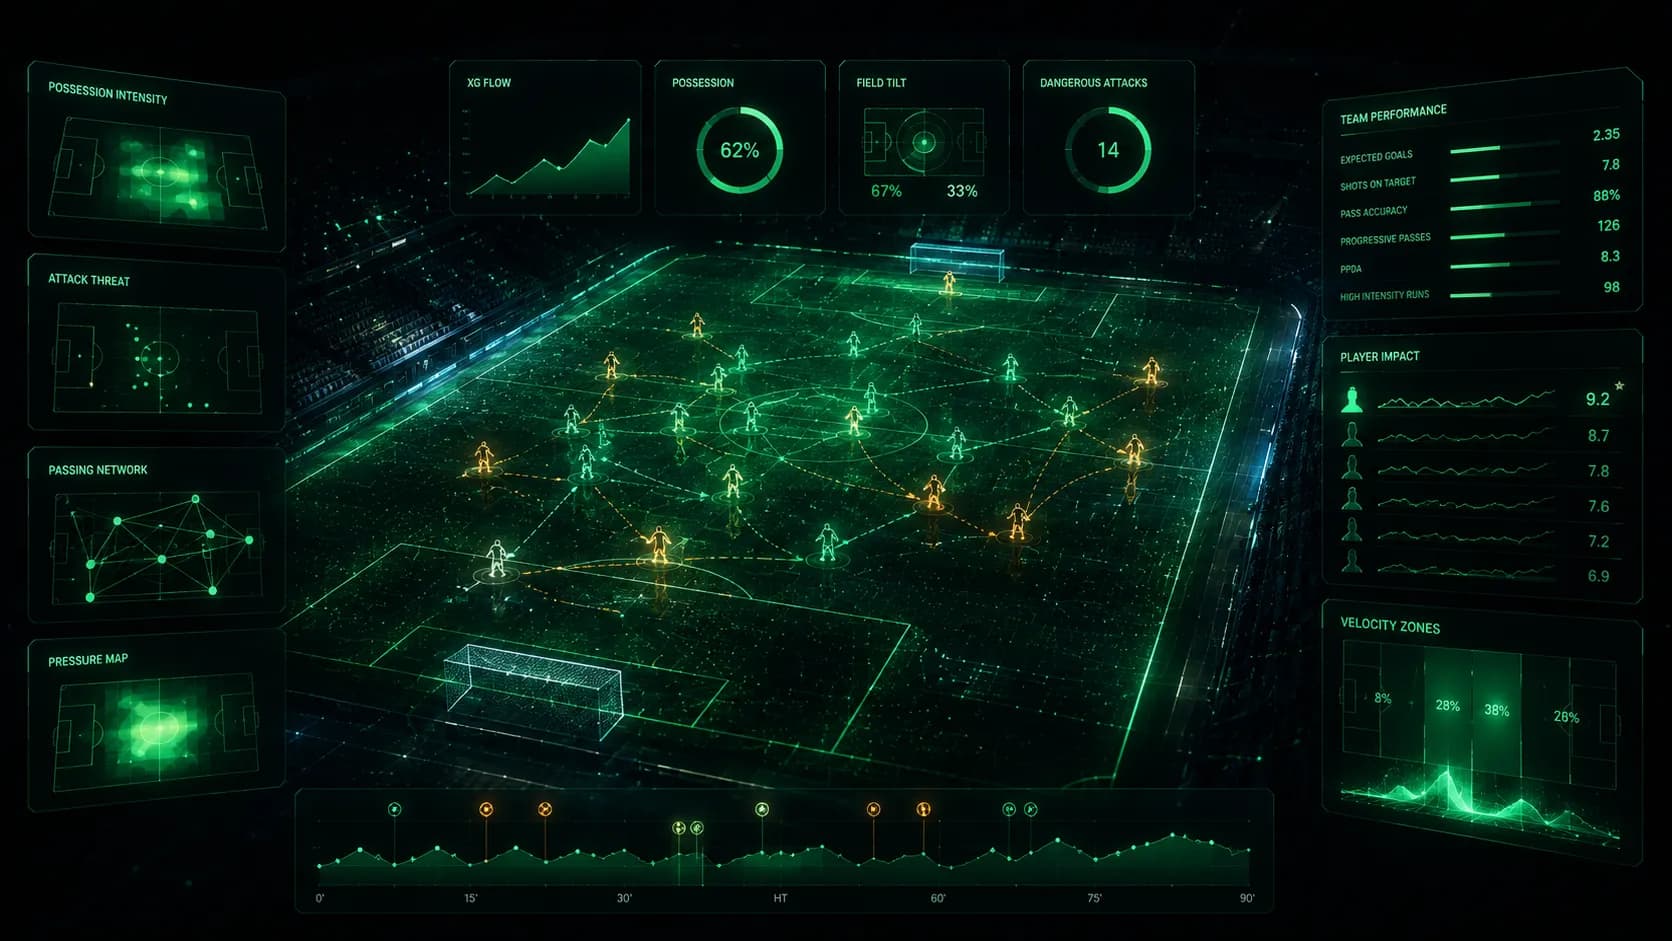
What you get
Performance models
Team and player metrics built on the same transparent engine.
Opponent analysis
Model-led previews and tendencies, ready for the analysis room.
Player development
Track form and contribution over a season, not a highlight reel.
Exports and dashboards
Share branded graphics and feeds with staff and stakeholders.
The analysis room, on the data
A sample club dashboard. Performance, momentum and tendencies in one read.
Riverside FC
Sample match · W 2-1xG for
1.84
per match
xG against
0.96
per match
PPDA
8.2
press intensity
Possession
58%
in-play
xG momentum · sample match
Attack zone tendency
Pitch thirds · attacking direction →
Illustrative dashboard on sample data with a fictional club. Statlytics is in early access.
Request early access
Tell us about your club and we will set up a working session.
Where the goals actually come from
Shot location and quality, per club.

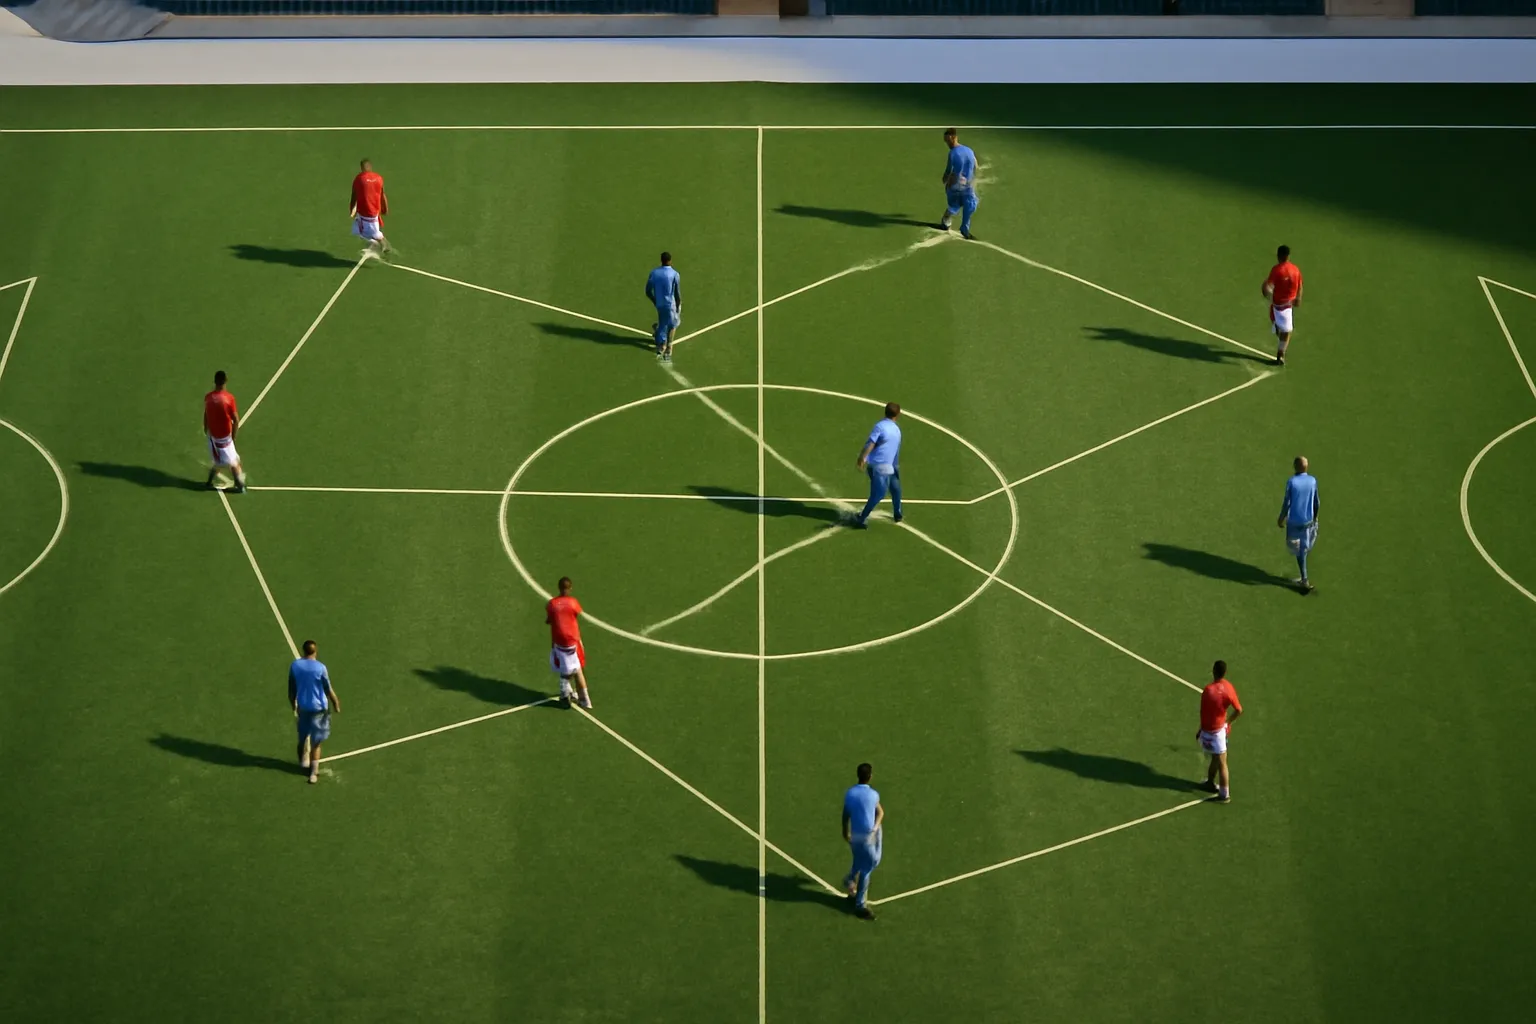
How the team actually moves the ball
Passing network · sample match
Line weight = pass volume between average positions
Touch density · sample match
Attacking direction →
The match, as the model saw it live
A win-probability curve reacting to real match events.
Win probability · sample match
Riverside FC 18%Full time · 90'
Set pieces and squad load
Set-piece outcomes · sample match
Corners (8)
- Shot 3
- Cleared 4
- Retained 1
Free kicks (6)
- Shot 2
- Cleared 3
- Retained 1
Rotation load · last 8 matches