
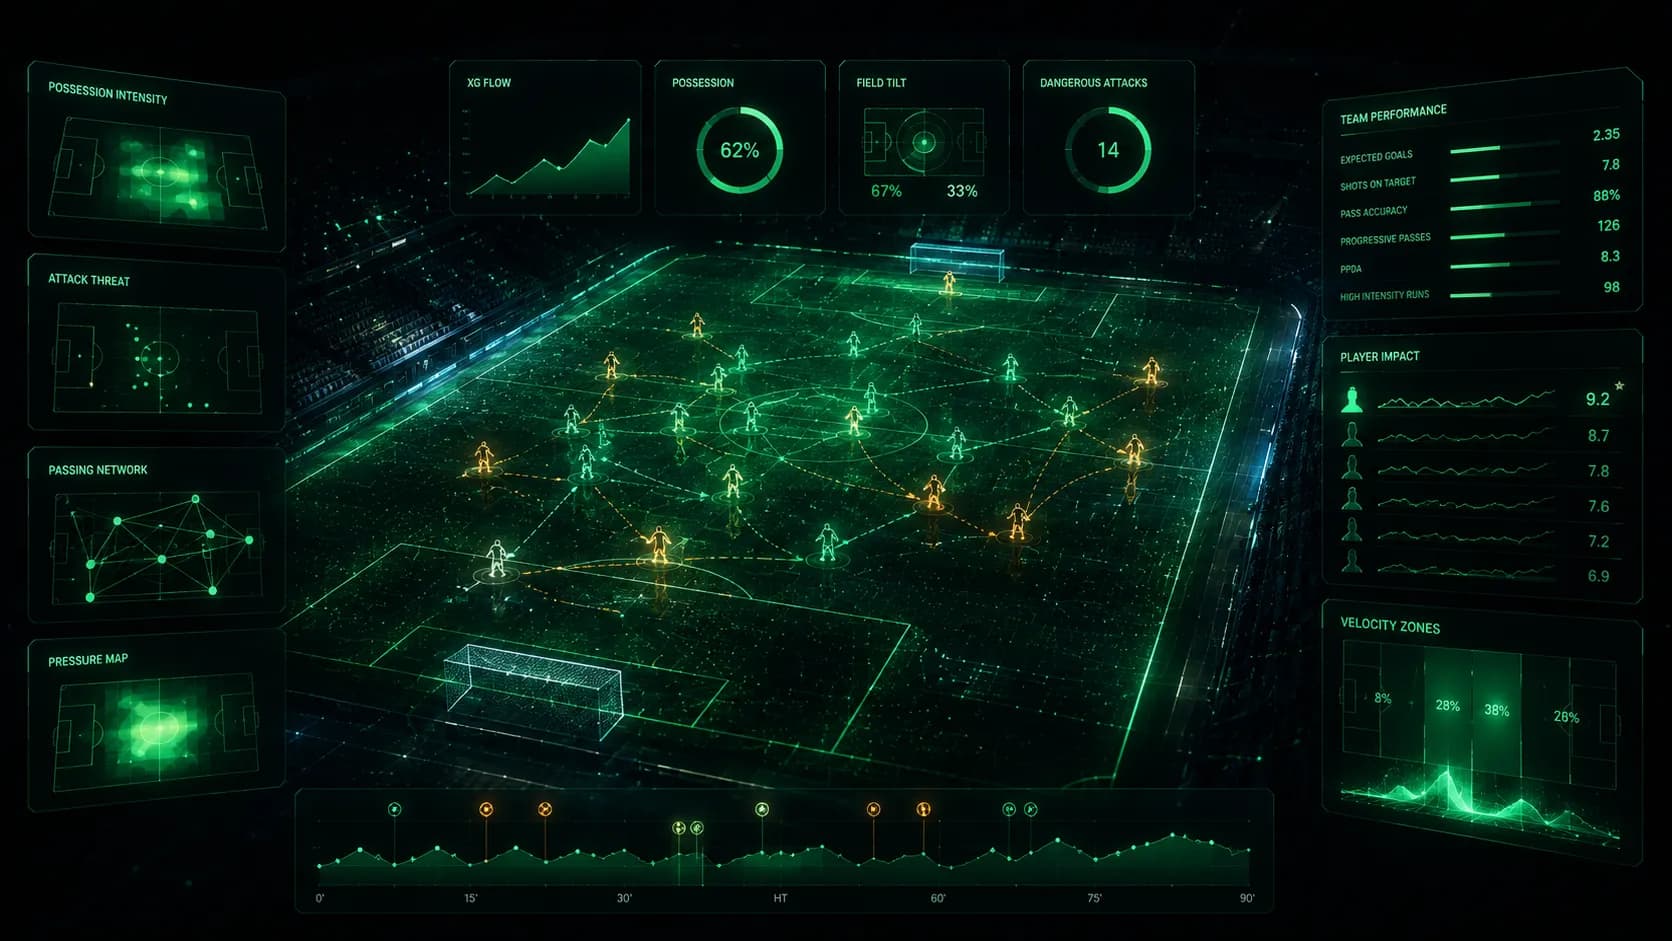
제공 항목
성과 모델
동일한 투명 엔진을 기반으로 구축된 팀 및 선수 지표입니다.
상대 분석
모델 기반 프리뷰와 추세를 분석실에 바로 제공합니다.
선수 발전
하이라이트 릴이 아닌 시즌 전체의 폼과 기여도를 추적합니다.
내보내기 및 대시보드
브랜드 그래픽과 피드를 직원 및 이해관계자와 공유하세요.
데이터 위의 분석실
샘플 클럽 대시보드입니다. 성과, 모멘텀, 추세를 한눈에 파악할 수 있습니다.
Riverside FC
Sample match · W 2-1xG for
1.84
per match
xG against
0.96
per match
PPDA
8.2
press intensity
Possession
58%
in-play
xG momentum · sample match
Attack zone tendency
Pitch thirds · attacking direction →
가상의 클럽을 사용한 샘플 데이터의 예시 대시보드입니다. Statlytics는 얼리 액세스 중입니다.
얼리 액세스 신청
클럽에 대해 알려주시면 작업 세션을 준비하겠습니다.
Where the goals actually come from
Shot location and quality, per club.

How the team actually moves the ball
Passing network · sample match
Line weight = pass volume between average positions
Touch density · sample match
Attacking direction →

The match, as the model saw it live
A win-probability curve reacting to real match events.
Win probability · sample match
Riverside FC 18%Full time · 90'
Set pieces and squad load
Set-piece outcomes · sample match
Corners (8)
- Shot 3
- Cleared 4
- Retained 1
Free kicks (6)
- Shot 2
- Cleared 3
- Retained 1
Rotation load · last 8 matches