
クラブと連盟向けのパフォーマンス分析
StatlyticsはLemeisterエンジンをフットボール部門に導入します。試合と選手のパフォーマンスをモデル化し、説明します。
powered by MeisterIQ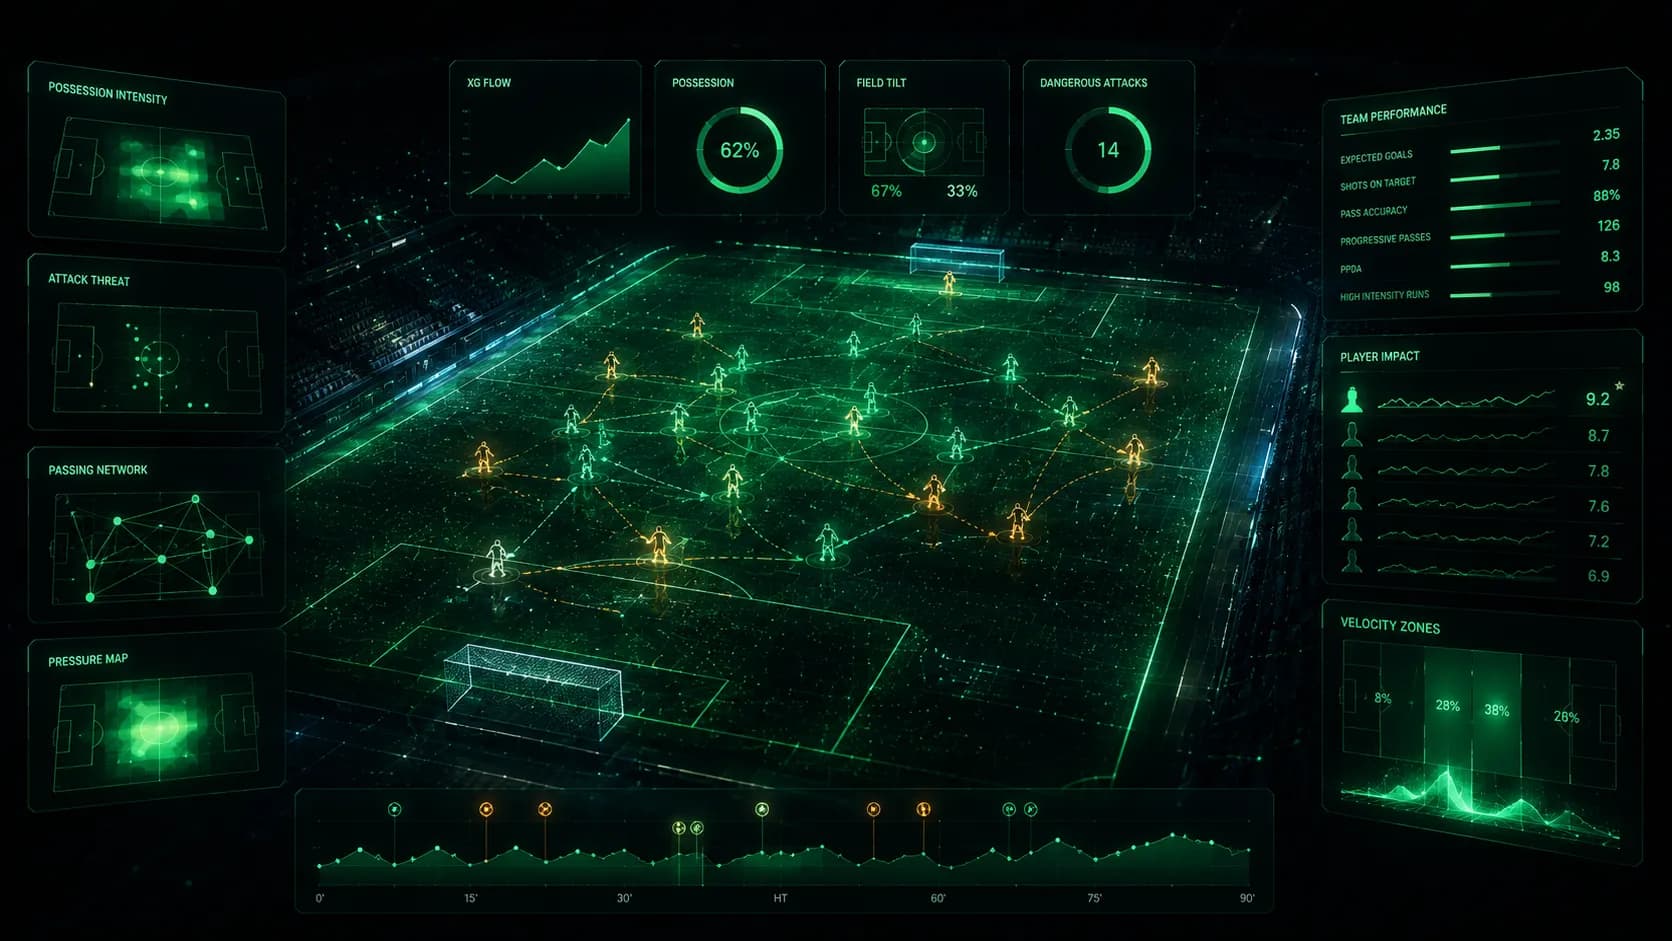
含まれるもの
パフォーマンスモデル
同じ透明なエンジンに基づくチームおよび選手メトリクス。
対戦相手分析
モデル主導のプレビューと傾向、分析室でそのまま使用可能。
選手育成
ハイライトではなく、シーズンを通した調子と貢献度を追跡。
エクスポートとダッシュボード
ブランド入りグラフィックとフィードをスタッフや関係者と共有。
データ上の分析室
サンプルクラブダッシュボード。パフォーマンス、勢い、傾向を一目で把握。
Riverside FC
Sample match · W 2-1xG for
1.84
per match
xG against
0.96
per match
PPDA
8.2
press intensity
Possession
58%
in-play
xG momentum · sample match
Attack zone tendency
Pitch thirds · attacking direction →
架空のクラブのサンプルデータを用いた説明用ダッシュボード。Statlyticsは早期アクセス中です。
早期アクセスをリクエスト
クラブについてお知らせください。作業セッションを設定します。
Where the goals actually come from
Shot location and quality, per club.

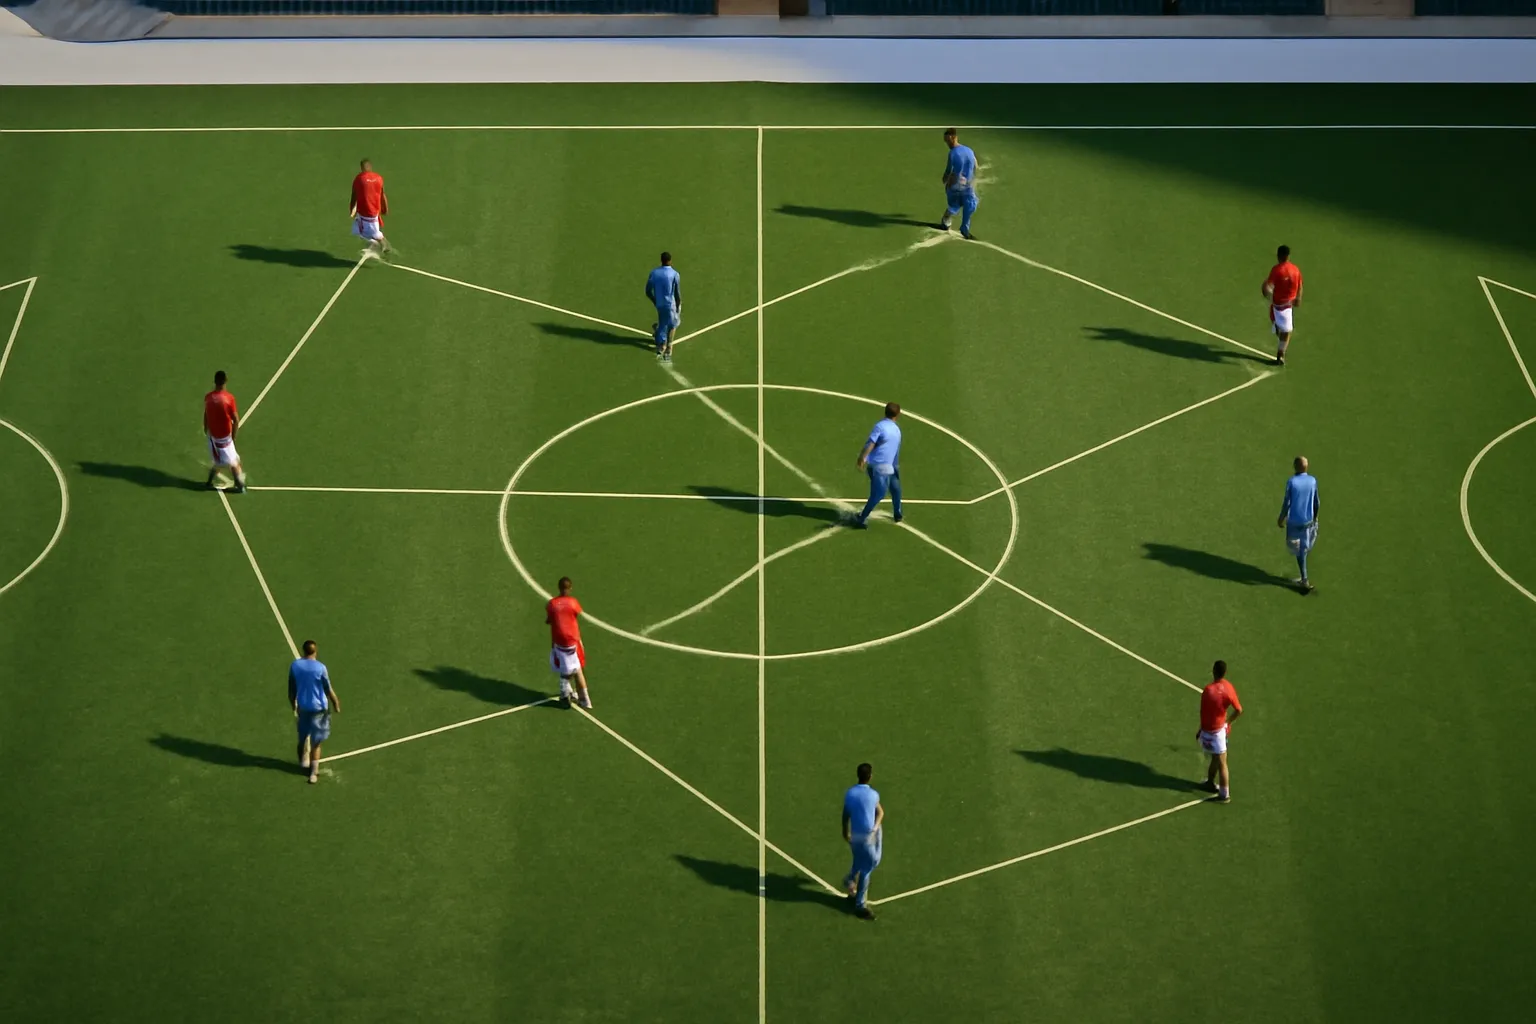
How the team actually moves the ball
Passing network · sample match
Line weight = pass volume between average positions
Touch density · sample match
Attacking direction →
The match, as the model saw it live
A win-probability curve reacting to real match events.
Win probability · sample match
Riverside FC 18%Full time · 90'
Set pieces and squad load
Set-piece outcomes · sample match
Corners (8)
- Shot 3
- Cleared 4
- Retained 1
Free kicks (6)
- Shot 2
- Cleared 3
- Retained 1
Rotation load · last 8 matches